Claim to Know the Restoration and Remediation Industry? Not So Fast
Insight Exchange
Tune in to our podcast episode as L.E.K. Partners discuss the complex evolution of the restoration and remediation industry.

While the number of severe weather events in the U.S. has remained fairly consistent over the past 20 years at around 32,000 events annually, there can be significant variability (e.g., there were around 38,000 events in 2023), and the average cost of each event has risen.

It’s why providers of residential services along with building and construction companies, and their respective investors, need a way to better understand weather demand in the context of other demand drivers such as the macroeconomy and construction activity.

To that end, L.E.K. Consulting has developed the Weather Index for Service Essentials, or WISE, which comprises indices of heat/cold days and of extreme weather events that we’ve used to develop insights into building services categories, specifically heating, ventilation and air conditioning (HVAC) and roofing. WISE is an effective tool that allows us to forecast future demand. 

WISE overview

While demand for residential services such as HVAC and roofing is driven by a variety of factors, looking at the historical data clarifies to what extent changes in weather have impacted broader weather trends — and by extension, that demand — over time.

With our WISE index, “degree days” (measures of how warm or cold a particular location is) are calculated by measuring the difference between the daily mean temperature and 65°F (the typical baseline for no heating or cooling needed).

Cooling days are recorded when temperatures surpass 65°F; if the daily mean temperature reaches 80°F, for example, that equates to 15 cooling degree days. Heating days, on the other hand, occur when the temperature is below 65°F; if the temperature mean is 50°F on a given day, the result is 15 heating degree days.

The WISE index also examines the change in the number of extreme weather events that can influence demand for roofing, among other categories.

What the WISE index reveals

From the third quarter of 2022 to the third quarter of 2023, there was a notable increase in the number of times roofing-focused public companies referenced severe weather on their earnings calls. But whereas the roofing industry enjoyed higher shipments overall as a result of weather during that time frame, HVAC shipments fell in 2023.

Indeed, in 2023, the U.S. experienced fewer cooling and heating days compared with both the prior year (9%) and the 10-year average (6%), which was attributed to a cooler summer and a milder winter. Compared with the long-term average, the East Coast and the Midwest had fewer heating/cooling days, which implies relatively low HVAC usage. Conversely, there were relatively more heating/cooling days than the long-term average in the U.S. West and Southwest, leading to increased HVAC usage.

Meanwhile, compared with 2022, all regions of the U.S. experienced fewer heating/cooling days, which was attributed to a cooler summer and a milder winter and which led to a decrease in degree days and in HVAC usage (see Figure 1). 

In the fourth quarter of 2023, overall HVAC usage was lower compared with the 10-year average (9%), as the warmer-than-average winter led to a lower-than-average number of heating days and a decrease in HVAC usage. The milder winter compared with the fourth quarter of 2022 (12%) resulted in significantly fewer heating days, which drove a decrease in HVAC usage quarter over quarter (see Figure 2). 

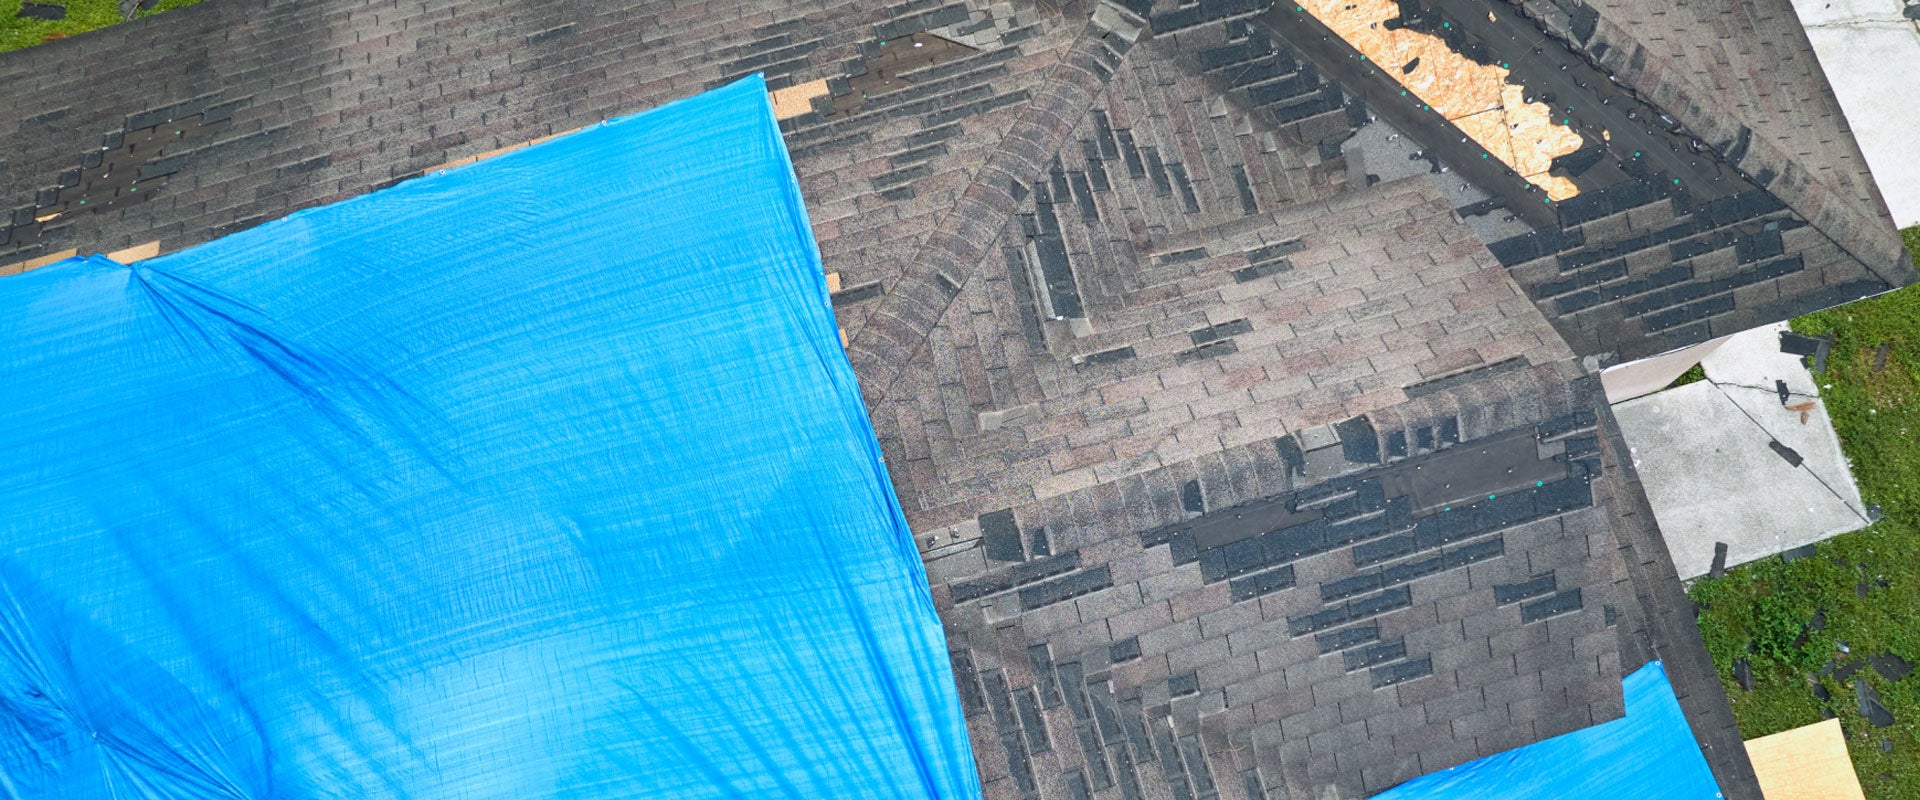
When it comes to roofing, in 2023 the number of extreme weather events (e.g., blizzards, floods, high winds, hurricanes/typhoons, strong winds, tornadoes, tsunamis) was higher than the prior 10-year average in the West, East North Central and West South Central regions, which drove higher demand. The East experienced a similar amount of extreme weather events compared with 2022, whereas the South and the West experienced a higher number of such events. Across the U.S., the number of significant weather events surged 20% between 2022 and 2023 (see Figure 3). 

That was not, however, the case in the fourth quarter of 2023.

The East experienced a number of extreme weather events that was more comparable to 2022, resulting in a roofing purchase pattern similar to that of previous quarters. For the U.S. as a whole, the number of extreme weather events was lower compared with both the previous year (49%) and the 10-year average (39%), driven by milder weather in the Midwest and the West (see Figure 4). 

Extreme weather has a positive short-term impact on roofing, but there are some indications this demand has a negative impact two quarters later.

L.E.K.’s regression analysis on the impact of the number of degree days on HVAC shipments was likewise statistically significant. It indicates that the number of degree days in a given quarter is expected to lead to an increase in the number of HVAC shipments in the following quarter.

A WISE approach

As the instances of extreme weather events — and their cost — continue to increase each year, the ability to predict demand is among the most crucial tools that providers of HVAC and roofing services, and their investors, can have in their respective toolboxes. With the WISE index, they can better understand building product performance and the potential directional impact of weather on demand.

Thank you to Saif Nazrul for contributing to this edition of Executive Insights.

L.E.K. Consulting is a registered trademark of L.E.K. Consulting LLC. All other products and brands mentioned in this document are properties of their respective owners. © 2024 L.E.K. Consulting LLC

Questions about our latest thinking?

Related Insights